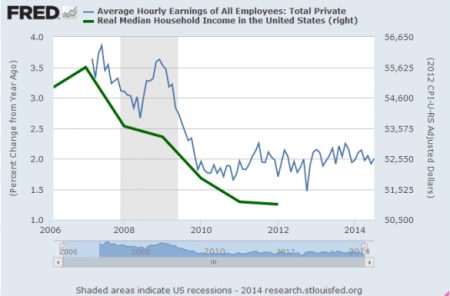
Does this chart portray an economic recovery in any way? Wages have been stagnant since the START of the supposed recovery in 2010. Real median household income, even using the highly understated CPI, is on a glide path to oblivion. You just need to observe with your own two eyes the number of Space Available signs in front of office buildings, strip centers and malls across America to realize we have further to fall. Low paying, part-time burger flipping jobs aren’t going to revive this debt saturated economic system. But at least the .1% are enjoying their Federal Reserve created high. Fiat is a powerful drug when administered in large doses to addicts on Wall Street.
The S&P 500 has risen from 666 in March of 2009 to 1,972 today. That is a 196% increase in a little over five years. During this same time, real household income has fallen by 7%. There have been a few million jobs added, while 11 million people have left the labor market. According to Robert Shiller’s CAPE ratio, the stock market valuation has only been higher, three times in history – 1929, 1999, and 2007. He seems flabbergasted by why valuations are so high. Sometimes really smart people can act really dumb.
The Federal Reserve balance sheet was $900 billion before the 2008 financial crisis. Today it stands at $4.4 trillion. The Fed has increased their balance sheet by 220% since the March 2009 market lows. Do you think there is any correlation between the Fed puppets printing $2.4 trillion and handing it to their Wall Street puppeteers, who used their high frequency trading supercomputers and ability to rig the markets so they never lose, and the third stock bubble in the last 13 years? It’s so self evident that only an Ivy League economist or CNBC anchor wouldn’t be able to see it.
(Read the rest of the story here…)